|
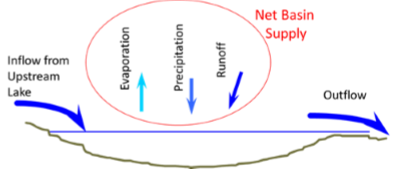
Net basin supply (NBS) is the primary driver of Great Lakes water levels. NBS represents the total contribution of water to each lake, excluding inflows from upstream lakes, outflows to downstream lakes, and diversions into or out of the lakes, as shown in the graphic to the right. In other words, NBS represents the net influence of precipitation over the lake, runoff from a lake's watershed into the lake, and evaporation from the lake's surface.
|
|
This page shows trends in precipitation, evaporation, and runoff from 1950 to 2022 for Lakes Superior, Michigan-Huron, Erie, and Ontario. There are four sections, one for each lake, that provide a table summarizing monthly and annual trends, a monthly graphic that displays values of precipitation, evaporation, and runoff by month from 1950 to 2022, and an annual graphic that shows the accumulated precipitation, evaporation, and runoff in each year from 1950 to 2022. A black line is plotted to help represent the patterns and trends in the data on a monthly and annual temporal scale. These trends are based on the data shown from 1950 to 2022 and may not be reflective of future trends. See the Data Description section for more information.
Use the links below to go directly to the graphs for each lake.
Lake Superior Lake Michigan-Huron Lake Erie Lake Ontario Data Information
Lake Superior
| Precipitation |
Evaporation |
Runoff |
| Precipitation during April shows an increasing trend since the 1980s through the recent period and was noticeably high in April 2022. |
Evaporation during the winter months has shown an increasing trend since the 1950s, and was particularly high in January of 2022. |
Runoff in May 2022 was very high, contributing to the overall increasing trend seen over the last two decades. |
| After two years of lower annual precipitation, 2022 was higher. |
On average, annual accumulated evaporation has been increasing over the last 7 decades. |
2022 runoff rates were higher than the previous two years. |
Back to top of NBS Components
Lake Michigan-Huron
| Precipitation |
Evaporation |
Runoff |
| February to May 2022 had higher precipitation than in 2021. |
Evaporation during July and August has shown an increasing trend in the last 3 decades. January 2022 experienced a major increase in evaporation. |
Runoff increased in the Spring and stayed relatively consistent otherwise. |
| In 2022, annual precipitation was below the higher rates of the preceding 5 years. |
Annual accumulated evaporation has shown an increasing trend over the last 4 decades. |
Over the last two decades, annual runoff rates show an increasing trend, but the past two years have been lower. |
Back to top of NBS Components
Lake Erie
| Precipitation |
Evaporation |
Runoff |
| October had a significant decrease in precipitation in 2022. |
Evaporation rates during September show a decreasing trend in the last two decades, despite higher rates in recent years. |
Runoff during December and January has been lower in recent years and indicates a slight decreasing trend. |
| Precipitation in 2022 was lower than the past 5 years. |
Evaporation does not show signs of any trend on the annual timescale since 1950. |
After several years of high runoff, rates have been lower in the past few years. |
Back to top of NBS Components
Lake Ontario
| Precipitation |
Evaporation |
Runoff |
| July and October saw a drop in precipitation in 2022. |
Evaporation in May, June. July, and August, shows a slight increasing trend in the last two to three decades. |
Lower runoff rates were experienced in January and October 2022 than in recent years. |
| Since the 1970s, high annual rates of precipitation have been more frequent. |
Annual rates of evaporation in the last two decades have been generally higher and show a slight increasing trend. |
After a few years with high runoff, recent years have had lower runoff rates. |
Back to top of NBS Components
Data Information
NBS Component Data
Precipitation data is coming from the Great Lakes Seasonal Hydrological Forecasting System.
Evaporation data is modeled using the Large Lake Thermodynamics Model (LLTM).
-
Croley, T. E. (1989). Verifiable evaporation modeling on the Laurentian Great Lakes. Water Resources Research, 25(5), 781-792.
Runoff data is modeled using the Large Basin Runoff Model (LBRM).
Graphics inspired by Hunter et al. 2015.
- Hunter, T. S., Clites, A. H., Campbell, K. B., & Gronewold, A. D. (2015). Development and application of a North American Great Lakes hydrometeorological database—Part I: Precipitation, evaporation, runoff, and air temperature. Journal of Great Lakes Research, 41(1), 65-77.
**The black lines in the graphics are calculated using a locally weighted regression, more information located here: https://www.rdocumentation.org/packages/stats/versions/3.5.1/topics/loess
All NBS graphics will be updated in the spring of each year.
Back to top of NBS Components